It's time for the annual statistics roundup!
I'm not obsessed with making my numbers look a certain way but I am interested in looking at stats. It's fun to see what people are looking at the most, where people are coming from, blogging trends, and how other trends affect my blog posts.
Unlike past years, I don't have a bunch of monthly "stats reports" to write off of this time because I got tired of making them a while ago. I honestly stopped looking at stats months ago. This post is going to be written from on-the-spot observations as I browse through Jetpack (I have access to Jetpack stats again!) and Google Analytics.
Check out past yearly stats deep-dives here.
2025 blog views
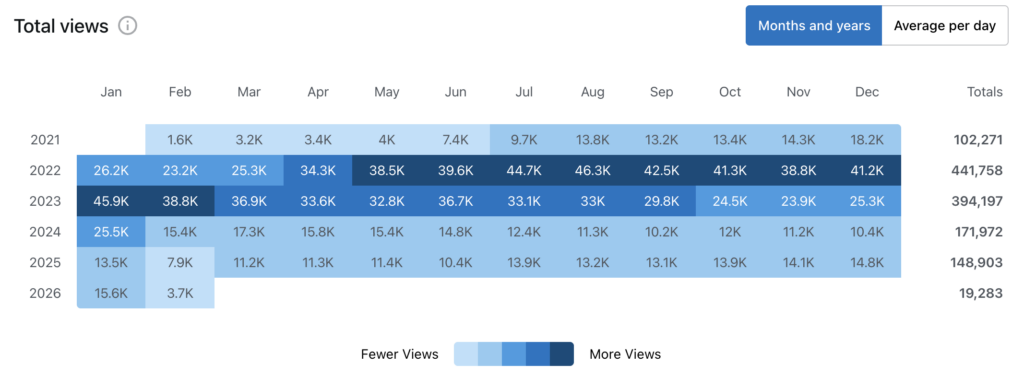
On it's own, 2025 was a good year with almost 149k views. Compared to other years, it doesn't stand out much. I didn't expect a lot from the year though so the fact that it got this much is great. I stopped caring about writing posts that would get more attention over 2 years ago and, hence, I'm not surprised by the downward trend. I expect 2026 to get even lesser views, possibly totalling to less than 2021's number.
The views dipped in the beginning of the year and picked up a bit again in the second half, settling around 13k a month for the second half. End of 2025 didn't have an uptick in stats like I expected. From 2021 to early 2025, I noticed that there is always a sizeable jump in stats in December and January. December 2025 had a very small jump, mostly due to a specific post that I published.
I just realised that the second half of 2025 got more views than the second half of 2024. Interesting. I can't think of a reason why. I was on the same posting schedule and my content was pretty similar too. Apparently my top 3 posts (which were published in 2021-2022) got a bit views in 2025. 🤔
sources of traffic
As always, search engines accounted for most of the traffic. Even though I'm not writing posts that would get significant traffic from search engines, my older posts are still raking in views. 67% of blog views were through search engines.
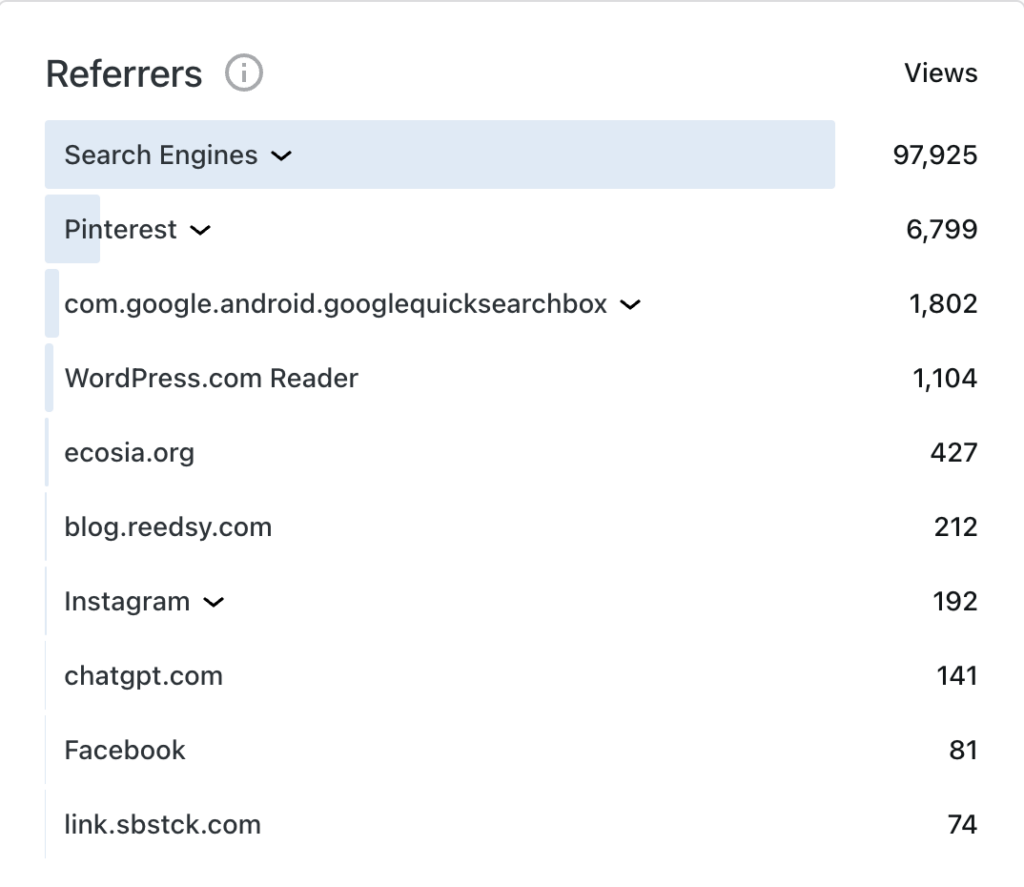
Keeping up with the pattern from the last few years, Pinterest remains at #2, contributing to 0.001% of traffic 😂 It's still second but the share of views has drastically changed. In 2024, it drove 14k views. In 2025, it reduced by more than half. I meant to work on Pinterest at some point (this year? last year?) but I didn't. I honestly don't think of Pinterest at all unless I'm looking for inspiration. I stopped putting any links to my blog on there. Plus, my blog posts are random and wouldn't work on Pinterest.
#3 is new. I don't know what it is. The Google app on Android phones, I guess? I've not seen it before. It could be the WordPress Android Reader, maybe? Because that's usually shown separately and is usually #3 but I don't see it this time. No idea. #3 onwards the views share is minuscule anyway.
Interestingly, Instagram drove (a bit) more views than 2024 despite me being even more absent from the app. I barely remember to promote my posts there and I probably shared 3-4 times in the year.
Traffic from AI chats started appearing in 2024 and increased in 2025. I expected that. I did not expect ChatGPT to be one of the top 10 sources, though. Do people really click through from AI answers to websites? What were people looking for that they were interested enough to come to my blog post? Unfortunately, there are no tracked searches for AI that we can see like with search engines.
I'm surprised to see Substack at #10. I tried the platform for newsletters for the first half of 2025. I didn't notice substantial referrals at that time and I stopped posting after a while anyway. It's interesting that it made it to the top 10 list. In fact, it is split into 3 "sources"—link.sbstck.com, substack.com, thewordyclub.substack.com—and yet, one made it to top 10.
best performing posts
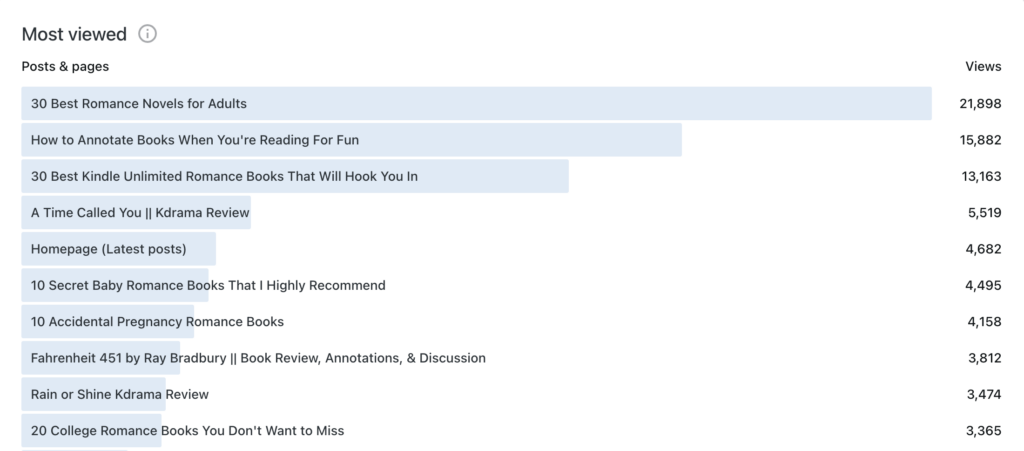
An era ended in 2025. How to Annotate Books For Fun is no longer the #1 after holding the spot for 4 years. I noticed that another post started taking over in daily views a few months ago and I became a bit sad. My post is a bit old and might be outdated for latest trends and there are newer posts by other bloggers. But I'm still sad. It's like saying goodbye to a foregone conclusion. Even if overall views reduced, this post was on the top. Until now.
The top post in 2025 was 30 Best Romance Novels for Adults. It's doing well on search engines, almost bouncing back to how it did back in 2023. I haven't updated the post in a long time and I'm sure I can update it with better recommendations now, but I haven't. And it's still doing well. I don't know if people are liking the books from the post but people sure are looking at the post. Is the romance genre on a sudden rise this year, beyond the general TikTok trend that's been going on for over a year? What was new in 2025? I have not kept my hand on the pulse of the industry—I've been doing my own thing.
30 Best Kindle Unlimited Romance Books did well too. It was #2 in 2024 and dropped to #3 in 2025 but actually did better than in 2024. I guess romance books are on the rise. I wonder why my blog posts are popular. There are more than enough recommendations on social media. I guess some people still search the old fashioned way.
The rest of the list is pretty similar to 2024. The top 11-20 spots were mostly taken up by Kdrama reviews which also garner quite a bit of views. People like discussing Kdramas. Most of the top posts are old posts as usual.
The top post that was published in 2025 was my review of Lovely Runner Kdrama. It's one of 2 Kdrama reviews I wrote last year and it did well because the Kdrama is super popular.
I had a post idea in the beginning of 2025 and I wrote it into my planner for later. I followed through with writing and posting it when the time came and it did well! It's been a long time since I specifically wrote a guide post for people to search and get inspiration/help from. I did a tiny bit of SEO research too. And it paid off! End of Year Content Ideas was published at the end of October and got many views at the end of the year. It got 850 views in total (as of now), 513 in December. It felt nice to see that my efforts paid off.
Another mildly interesting note: My Best Book Recommendations got more-than-usual traffic at the end of the year. I didn't optimise it for search engines and it doesn't usually get much traffic (around 20 views a month) but it got 219 views in December! I guess people were searching for books to read in 2026 and a handful of them made it to my post.
audience
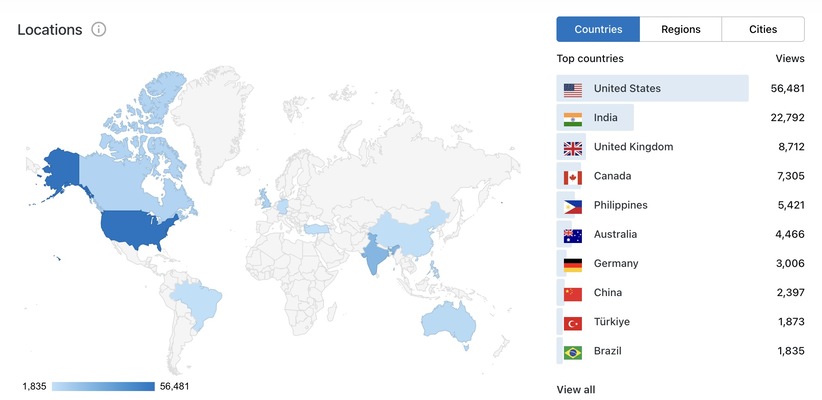
As always, US is #1 and India is #2. They contribute most of the traffic to my blog. The rest of the countries follow distantly with much lesser share of traffic. The list is identical until #7 every year.
One difference this year is that China is at #8 and this is the first time I'm seeing it in the top list. It's interesting that traffic from China has increased because I've seen the same observation mentioned by Hannah and Dini. Dini's was wayyy out of the way but Hannah's stats saw a small jump like mine. No clue what to make of it but it's an observation. Turkiye (#9) and Brazil (#10) are on the top 10 list for the first time too.
engagement
Engagement = likes and comments on posts. And blog subscriptions.
2025 saw 598 likes and 445 comments. The numbers are quite lesser than 2024's. As I write this post, the blog has 2644 subscribers (via WordPress and Email, at least. I don't think it tracks RSS feeds.) I haven't seen much subscriber increase ever since I went self-hosted but I usually see at least a constant. This time, it's about 20 less than the number I reported last year 😬
I wasn't good at engagement (commenting on other blogs, responding to comments on my blog) in 2025 so I'm not surprised that it's low. 2024 was low as well. The general trend is downward since blogging is barely a blip on most people's radar after social media has become the digital home for everyone. Search engine traffic doesn't count as "engagement" because people usually stop by to find out an answer or some information and leave.
To be fair, the book blogging community is still very much alive. I see many frequent bloggers and lots of comments on other posts. There are still so many bloggers doing blogging memes and discussions. It's really nice to see that. The bookish side of blogs is the only community I'm closest to but since most of my content isn't bookish, my blog is on the outskirts.
This blog mostly gets comments from people whom I've known for a long time. Most of the comments are from friends I made through blogging years ago. Some are from bloggers who I interact with only through comments on their blogs and mine. A handful are from offline friends, but then they usually just text me if they want to say anything.
Some posts get a bit more engagement if it's a "helpful" post or if I write about something popular. A handful of comments in 2025 came after I went on a commenting spree on other blogs which prompted them to check out my posts. None of the posts published in 2025 got noticeably more engagement.
I also haven't been keeping track, honestly. I'll go through all the posts now and talk about the top ones, hold on.
The post with the most likes was What's In My Work Bag? with 22 likes. I am actually very surprised by this! Wow. I started following my whims a bit more in 2025 and randomly wrote this post even though it's so out of what I usually write. I didn't realise that y'all liked it so much 😂
2 posts are tied for most comments: Reader Bait: My Top Ten Bookish Lures and My 2024 Blog Stats with 17 comments each. I believe this number counts my replies as well. There's not much in common between the 3 so I don't know if I can make a statement out of these 🤪 I'll just keep writing whatever is on the top of my mind.
According to Google Analytics, the "average engagement time per active user" was 1m 8s. Considering that most people come from search engines to quickly find some information, an average of 1 minute is great. Most of my usual posts are long and take longer to read so for the average to be 1 minute, I know that regular readers must be spending a lot of time on my posts. Thanks, y'all <3
chat with me!
Did you notice anything from the above stats which I missed? Did you notice anything in your blog stats—maybe something similar to mine? Was there anything specific that stood out in your blog stats like a certain post that got many comments or something that trended due to social media?
Sumedha spends her days reading books, bingeing Kdramas, drawing illustrations, and blogging while listening to Lo-Fi music. Read more ➔
LOL, I just came to this post b/c ChatGPT referred it when I asked about search engine traffic vs. WP Reader traffic for a WP.com blog. 🙂
wowww okay that’s one I did not expect 😂 especially since this post doesn’t answer that!
Ok so as usual I read a stats post and start snooping at my own stats because I'm nosey and I barely look at them. I noticed one of my posts from 2022 has suddenly seen a spike of traffic, from the latter half of last year and just last month it had the most views it's ever had since I posted it. It's my guide on becoming a Stay (a fan of Stray Kids) so I guess it's time I went back and updated the post. Since it seems to be doing well for some reason - I can guess that because of the group becoming more popular people can just happen across my post and click on it. I had a snoop to see if any AI was on my referrer list and ChatGPT is there sadly but only with 3. I'm so curious to see how posts perform across the years because the guide post of mine had a dead period of no views and now it's probably my top performing post this year. It's so interesting to see what posts that may have not done great initially suddenly start running away with the views.
it’s definitely interesting how posts shoot up randomly, it’s all about what’s trending due to various reasons. i’m sure all the bridgerton book summary posts are doing well with every season of the show 😂
Numbers are a funny thing, it's interesting to see you break yours down though and to see what's changed... both a lot and not a lot 😂
both a lot and not a lot is exactly right 😂