Bloggers talking about their stats is like people talking about their salaries. Stats are generally kept hidden and shared only with closest friends. When shared, it is in rounded-off numbers or increments (like +100) instead of the total. But everyone wants to know other bloggers' stats.
If blog statistics were actually reflective of a blogger's salary, I would understand the hesitancy.* But it is so even with people who blog as a hobby. For a long time, I followed that trend and attitude. I hid my stats, didn't talk about numbers or detailed insights from them, and didn't ask others about theirs.
Over the last few years, I've been trying to do better. I started sharing my numbers, discussing stats transparency with other bloggers, and encouraging people to share theirs. I've wanted to do an entire post on my blog stats for a while but I couldn't figure out a way to without it becoming chaotic.
Now that I'm armed with an entire year's detailed numbers, I'm super excited to share them with you. I have a lot of thoughts to share about my 2022 blog statistics. I love combing through them and realizing patterns. I'm a stats nerd and blogging fulfils that part of me. It's one of my lowkey hobbies, haha.
Not going to lie, I am hoping that I can encourage you to share your blog statistics through this post. Yes, I'm nosy. But also, it's easier to notice patterns when looking at data from multiple sources rather than just one. I'm hoping to start discussions about blog numbers and patterns through this.
*However, salaries also need to be spoken about! We need to break the conversation barriers in society and talk about money openly so that we're paying and being paid equally.
2022 blog views
In 2022, this blog received 441,748 views. In 2021, my blog was live for almost 11 months and received a little over 100k views. That itself is a feat so surpassing that by 4 times in 2022 was surreal.
This blog hit that number because I worked on increasing the daily average. Once I started over with this self-hosted blog, I stopped looking at overall statistics as much and started looking at day-to-day statistics. I tried to keep my daily average consistent and to improve on it. Even an increase in 5 views per day adds up.
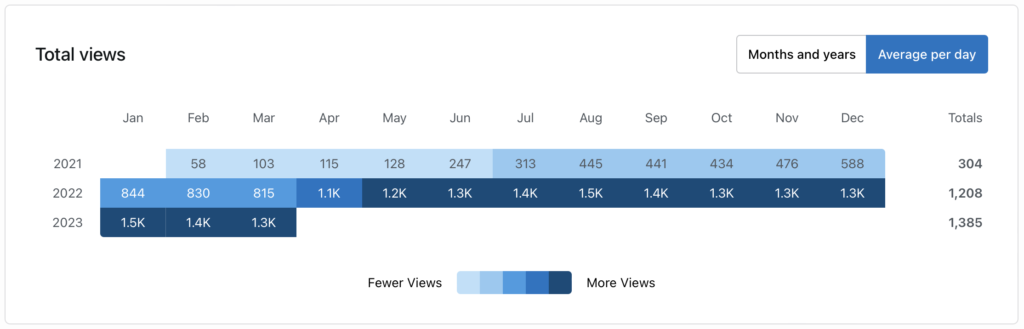
Breaking through the 1k number was hard but once I got through that, I didn't worry about the daily average too much. Even now, even though my stats are actually on a decline, I'm not worried as long as it's above 1k a day. Reaching 1k views per day was a specific goal of mine and I was really glad to cross that in 2022.
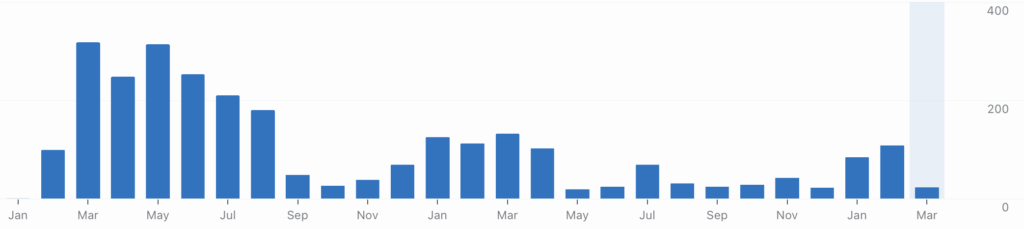
As shown in the image, there was a sudden increase in April 2022. Interestingly, it wasn't due to a trending post that blew up or a specific source of traffic. All of my posts that were ranking in search engines jumped up in rankings and the traffic brought in by each increased. Per post, it doesn't make much of a difference but all of them together made a big difference.
My domain authority increased to 18 in March (from 16 in February) and I do think that is an indicator of my blog showing up in search engine results more. My posts were showing for more keywords as well. In March, my posts were ranking under 100 (position) for 507 keywords. In April, it increased to 628.
At the beginning of 2022, I also started doing keyword research properly. My post on single-parent romance books went live in February and started ranking in search engine results in March (906 views). It started ranking showing in the first page of results in April (2.5k views) and is a contributor to the jump in stats.

Towards the end of the year, the stats became stagnant and started reducing slowly, mostly because I stopped posting as frequently. I was consistent until April and then reduced. I had increased the frequency of my newsletter and couldn't keep my blog up along with it. It reflected in the traffic in a couple of months.
The posts that were ranking in search engines started receiving lesser traffic as well. It wasn't one or two posts, but all of them. Even the single-parent romance books post that shot up in April went down later. The blog's domain authority dropped as well. I am convinced that frequent and consistent posting is linked to the blog's authority in search engines.
I have seen other bloggers say that their blog has grown in their absence but I see a correlation between my posting schedule and search engine rankings. It always takes a couple of months to reflect but it does. Of course, the correlation is more evident if there is a significant reduction in posts geared towards search engines like listicles.
I believe that it is because there aren't new posts that are conquering new keywords and old posts aren't growing or they are losing ranks due to newer posts by other websites. The fact is that more posts = more referrals from search engines, for me.
Currently, traffic from search engines is reducing almost every day. There are newer and better posts surpassing mine for popular keywords. I'm not actively working on updating my posts or writing new posts geared towards search engines. I am not as consistent or frequent as I used to be either. Hence, the change in traffic isn't surprising to me.
sources of traffic
Although this blog has received traffic from various sources (some of them being total surprises), there are a few sources that stand out. The most interesting part is the monopoly in my traffic sources and how they affect the overall numbers.
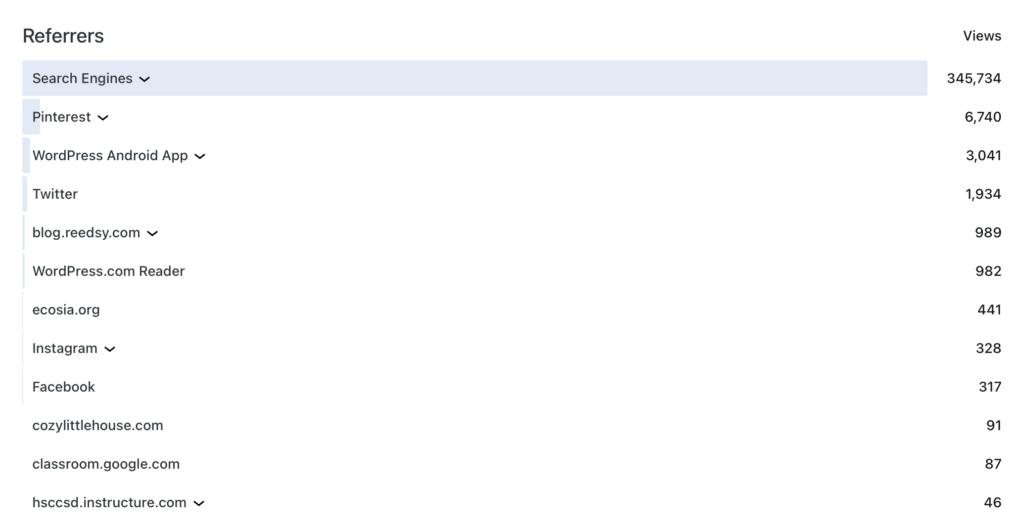
As you can see, search engines are the source of traffic for this blog. They contribute to almost 80% of the blog's total views. Sometimes, it is a little scary that the blog depends on search engines so much because any change in search trends or algorithms affects the blog greatly. Lately, it doesn't matter as much because my current focus is to post consistently and improve engagement instead of views.
The second highest traffic source is Pinterest. In 2022, I started truly working on my Pinterest. I didn't follow a strict pinning strategy like other bloggers or what is suggested in all the Pinterest guides, though. I did not have time for that. I did what I could as consistently as my schedule allowed. It made enough of a difference. You can see all the Pinterest numbers and insights in my resource library.
Despite going self-hosted, almost all of my followers are through WordPress so it's not surprising that it is one of the top referrers. Weird that the traffic from the android app is specifically separated out but anyway. It is the third-highest traffic source for this blog.
An interesting source is Reedsy. My blog got added to a book blogs list on Reedsy in 2021 and there has been steady traffic from there since. Initially, it was a lot because my blog was listed on page one but as more blogs get added, my blog went to the subsequent pages and the traffic reduced accordingly. I received book review requests proportionate to the traffic.
Social media contributes to a chuck of the blog traffic, of course. I actively promoted the blog on Twitter for most of the year and it resulted in quite a bit of traffic. Once the Twitter algorithm changed to shun Tweets with links, the traffic reduced accordingly. I also stopped promoting as much when life became hectic.
I had an active Instagram account so the traffic from there makes sense. People generally don't leave the Instagram app to read blog posts so I'm not surprised that it's not much compared to Twitter. The traffic from Facebook is a little interesting because I don't use Facebook. I don't log into the platform or promote the blog on it. I am assuming that some of my posts were shared by people on the platform which led to some traffic from there.
The last two referrers in the image are educational and I'm quite proud of them. My blog post on how to annotate books for fun took off on search engines in 2021 and soon made its way to classrooms as well (apparently). One time, I received 50 referrals from Google Classroom in 5 minutes! (I only noticed it because I was on the WordPress dashboard to analyse my statistics, LOL. Good timing.) I love that my blog post is being used in classes even though the post was written without keeping academia in mind.
best-performing posts
Since search engines contribute to such a high percentage of my blog views, the best-performing posts are the ones that do best on search engines. If we consider views as the indicator, of course.
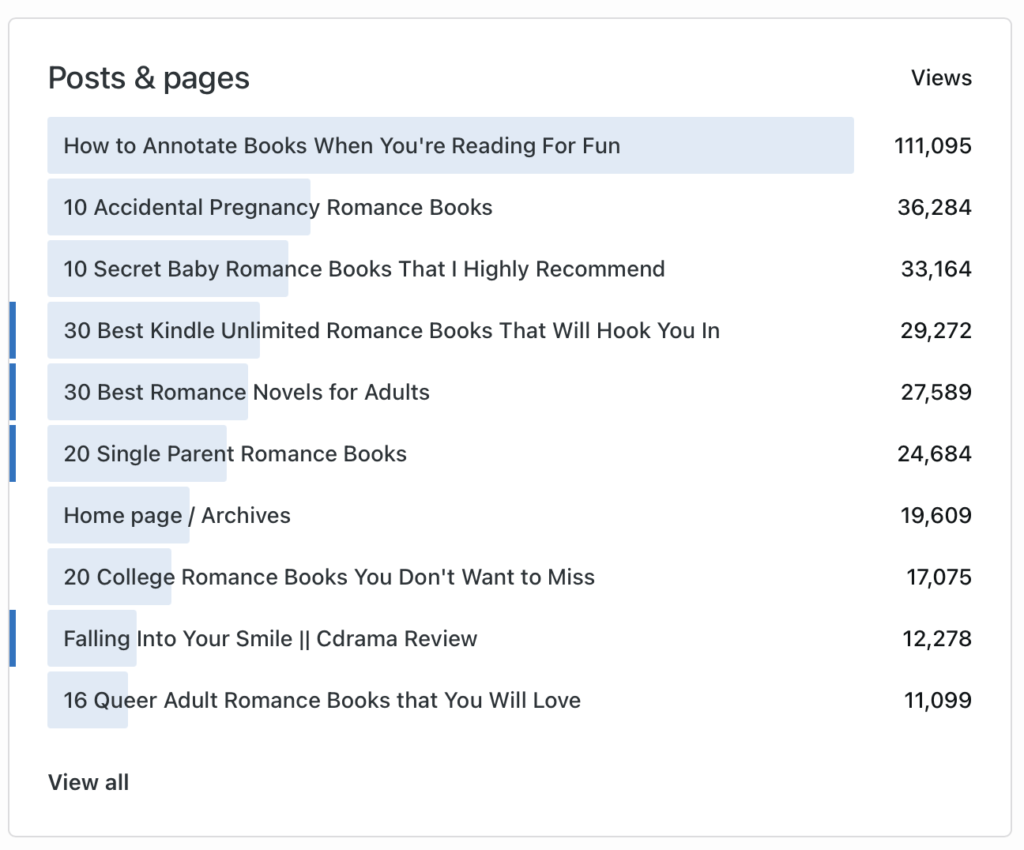
How to Annotate Books When You're Reading For Fun became the top post in June 2021 and stayed there until October 2022. Out of 441k views in 2022, this post contributed 111k which means that it accounted for 25% of my blog traffic. It single-handedly pulled my blog up by a lot. As you can see above, it performed far better than the second-best post on my site.
My blog's overall statistics started falling in August 2022, a couple of months after I stopped posting as much. The difference showed because this post's views started dropping. Another blogger's post on the same topic overtook mine in search engine rankings and hence the traffic was reduced. There's a huge amount of difference between the first 3 ranks for any keyword so falling from the first rank to the second rank hit the numbers hard.
In November and December, Kindle Unlimited Romance Books was the best-performing post followed by the annotation post. It was the best-performing post of the ones that were published in 2022.
Almost all of the best posts were bookish listicles. Although I published a variety of posts, these were good for search engines and hence shot up in views. Once I figured out that lists did well, I wrote whatever I could come up with. Not all of them did well but the ones that did, made all the effort worth it.
A notable post in the list is Falling Into Your Smile Cdrama Review because it is the only non-bookish post. On my previous blog (with the same name but before self-hosting and starting over with content), the best-performing posts used to be Kdrama reviews. My bookish posts did not stand a chance, not even the lists. I didn't know that lists could do well so I didn't work on them as much. That has changed drastically with this blog because the bookish posts outshine the drama posts.
My review of Falling Into Your Smile was ranking high in search engines when the show was added to Netflix in April 2022. A lot of people were suddenly searching the term and stumbled on my blog. It got a ton of views for two months before reducing and settling at an average for the rest of the year. Those two months of extra views are the reason it is in the top posts lists.
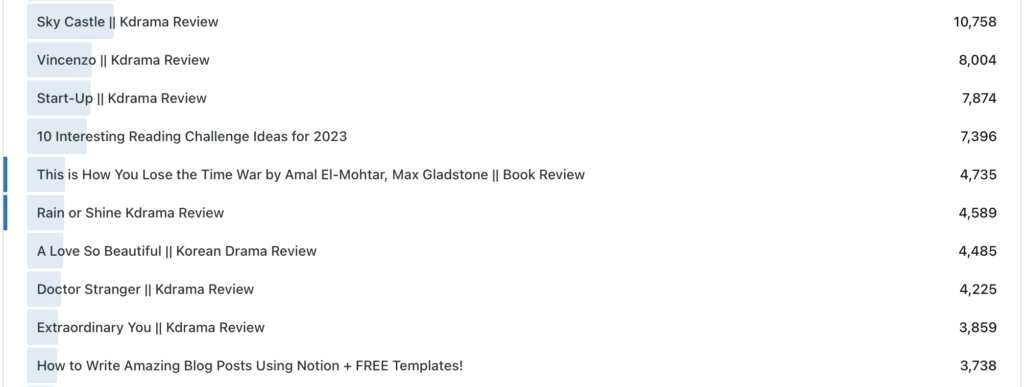
If I expand the list of posts sorted by the number of views, the next set of best-performing posts consists of mostly drama reviews. I wasn't surprised by this since I've known that Kdrama reviews do well and there is a huge audience for Asian dramas nowadays. Other than a couple of bookish posts (a list and a review) and a blogging guide, spots 11-20 are filled with Kdrama reviews.
The lone book review that got enough traffic to compete with dramas is my review of This is How You Lose the Time War. Although this book is popular (to an extent), I did not expect it to receive a lot of search engine traffic. Mainly because there were reviews by sites much more popular than mine and with high domain authority. So, I did a little bit of keyword research to see if there was any untapped keyword that I could use. (Details on the keyword & more are in my SEO case studies.) That keyword research is the only reason this review got enough traffic to be in the top 20 spots.
The only post on blogging that made it to the top 20 list (at the 20th position) is How to Write Amazing Blog Posts Using Notion. Notion had been booming for a while before I wrote the post and there were tons of guides to set up Notion workspaces. Instead of a regular guide, I wanted to share a process using Notion. Since I use Notion for my blogging, it was easy to come up with this post.
The only reason this post got enough views to be in my top 20 was that it was in the results for keywords that it does not satisfy. People searched for "notion blog" and were led to my blog post even though the intent was different. Once the algorithm realized that my post didn't match the criteria, it removed my post from those results. However, those keywords had quite a bit of traffic and even two months under them was enough to pull this post up in numbers. I shared how this post's traffic taught me how SEO works with details in my SEO case studies.
audience
I use WordPress and the statistics dashboard that comes with it. Although I have Google Analytics configured, I find those statistics overwhelming and confusing. I also don't have much use for all of those factors since I blog as a hobby. Hence, I mostly refer to the WordPress dashboard.
An interesting thing that WordPress keeps track of is the location of readers. I have always been intrigued by what it says, even if I don't take any action by using that data.
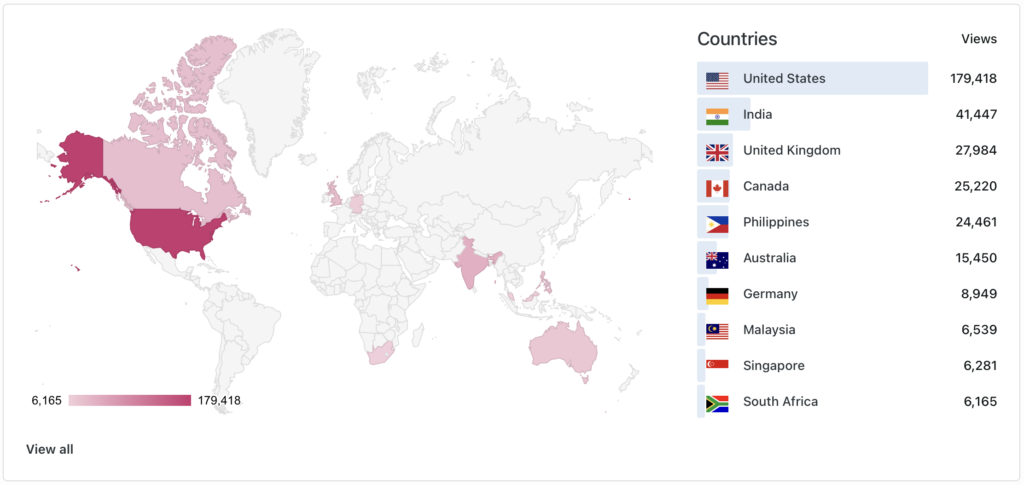
Although I'm blogging from India, most of my readers are from the United States. And as you can see, the number of visitors from there is far more than India which is in second place.
The most interesting part is that the numbers have always looked like this. Even when I was blogging anonymously and used to talk about my life instead of books and didn't promote on social media, most of my readers were from the USA. That was before any of my blog posts received traffic from search engines.
I'm not sure if it is because blogs are simply more prominent in the USA or if there's another reason. Looking at Naemi's 2022 stats, I'm inclined to believe the former. I thought only my stats were weirdly skewed towards the USA but maybe it's like that for everyone and I didn't know it because we don't talk about it.
engagement
Here's the thing: a lot of bloggers do talk about engagement but mostly without the numbers. We say "engagement is lower now than a few years back" without saying how much. "Low engagement" can mean very different things to different bloggers. Followers, likes, and comments metrics can look very different depending on what kind of content a blogger makes and what kind of audience they have.
I'm going to mainly talk about comment numbers because that is a better form of engagement than likes. It takes active effort to comment on a post. I won't be talking about follows as much because I believe that follower numbers aren't reliable for a self-hosted blog.
In Pages Unbound's 2022 Blogging Survey results, it is seen that most bloggers receive 0-5 comments per day. That amounts to a maximum of 35 comments a week and 150 comments a month. I believe that we need further subsections by counting comments per month to see it better because I understand engagement better that way. There's a big difference between 1 comment a day and 2 comments a day because it can mean 30 comments or 60 comments a month.
And an important thing to note: comment numbers include the blogger's comments. If I get one comment today and reply to it, my WordPress dashboard shows 2 total comments. So the actual engagement is half of that.
From February 2021 to August 2021 (my first few months with this blog), I was getting 200-300 comments every month with 4-8 new posts every month. After that, I was in a blogging slump for a while and posted only once a month so I had around 30 comments a month.
The number of comments I get in a month is proportional to the number of posts I publish. If I publish 4 posts, I get easily over 100 comments. If I get only one, I have 20-30 comments.
Since I posted almost twice a week for the first few months after starting this blog, the number of comments from then are high. They're also high because I put a lot of effort into writing content that appealed to my audience instead of focusing on SEO. Once I stopped posting as much, my engagement clearly took a hit. I haven't posted more than 4 times since August 2021 and the impact is shown in the above graph.
I got 441k total views in 2022 but had only 730 comments in comparison. I'm sure you're thinking: what about the SEO traffic? If more people are visiting then there should be more comments, right? August 2022 was my best month according to views (46k views) but I had only 31 comments. That was because I posted only once.
The truth is that more traffic from search engines does not mean more followers, likes, or comments. Most people who visit simply read the post and exit, most of the time without taking a look at another post. That is understandable because I often do the same. When we search for something, we want a specific answer and leave when we get it. We don't stick around to browse unless we are bored and have the time.
Blog aesthetics and writing style can interest the reader to stay but they will not win against the reader's time and intentions, no matter how much we try. People mostly don't stick around and follow if they are coming from search engine queries.
I mostly receive comments from my friends and followers who have been following the blog for a while. Hence, even though my blog had a lot of views, the number of comments depended on the number of posts published.

That being said, there are a few cases where readers from search engines comment. The scenarios that I've seen the most are:
- When they highly agree with what I said in the post. This generally applies to book and drama reviews.
- When they vehemently disagree with what I said. I have received a bunch of comments on my review of Vincenzo saying that I did not understand the drama and the 20 different ways I was wrong.
- When the post was very helpful. I've received a bunch of lovely appreciative comments on my annotation post and a few other guides.
I have received quite a few comments from people who have come through search engine results but the on comparing with the comments I receive from followers, they aren't much.
An interesting pattern in my statistics is that my search engine traffic is inversely proportional to the number of comments received. I am aware that posts that do well on search engines aren't great for my regular followers and don't invite comments as much while discussion and casual posts get a lot of comments but don't rank on search engines. However, seeing it play out in my statistics is interesting.
For a while in 2021 and 2022, I was focused on writing posts that would rank on search engines. I would do keyword research and make sure that my blog post is hitting all the points. They would soon rank and get traffic from searches but they always received lesser comments. During other months when I prioritized wrap-ups and discussions, I would see an uptick in engagement but stagnant referrals from search engines.
I don't think that all types of content fall into only one of the two buckets but a lot of my content is like that. For example, now I am focusing more on discussion and personal posts (like this one!) which don't have a specific place in search queries. Hence, I know that my search traffic will reduce in the upcoming months but I have hopes of getting more comments and shares.
One day, I might find out how to balance the two. That day is not today, haha.

endnotes
Every blog's statistics depend on the type of content and the blogger's intentions. If you post more evergreen content, you are likely to receive search traffic in the long run and lesser engagement from followers. If you write in English, you are more likely to have a lot of readers from the USA and the UK. If you write more guides and how-tos, your posts might just be shared in academic spaces.
Only you can figure out the patterns in your statistics because you see them all the time and know the content intricately. However, it is easier to spot patterns when backed with more data. Either you have more data by blogging for a long time and capturing all of the factors or you use data from other blogs along with yours.
One of the ways I try to figure out patterns in engagement is by going through posts by other bloggers and the comments on them. Even when I'm blog hopping as usual, I take a minute or two more to read through other comments and notice what kind of writing and topics compel people to comment. The vibe of comments also varies highly between blogs depending on the post's vibe. The same person could write in all caps with only feelings under one post and be a literary critic under another.
And when other bloggers share their numbers, I take note. I especially loved Sophia's and Naemi's recent posts on their 2022 statistics (I actually took inspiration from theirs to put this post together).
To capture and go through my statistics in a better way, I make monthly blog reports for myself on Notion. I track regular things like followers, referrals, social media numbers, and the latest post statistics. I also note down what I did the previous month (like whether I posted more discussions or promoted more on Pinterest) and what kind of effect they had. Sometimes, those reports become a personal vent space (like complaining about a blogging slump).
With two years of blog reports, I have already made quite a few observations (almost everything that I mentioned in this post, actually). I'm sure I will notice more as time goes on. With more data comes more understanding. If you want to start gathering data and making reports of your own, you can get my monthly blog report template in the resource library!

chat with me!
What are your thoughts on stats transparency in the blogosphere? What do you wish bloggers discussed and shared more often? Is there anything that you're specifically nosy about?
Have you noticed any patterns in your statistics or have theories about mine? I'm all for discussing stats and theorizing so drop all your thoughts in the comments!
Sumedha spends her days reading books, bingeing Kdramas, drawing illustrations, and blogging while listening to Lo-Fi music. Read more ➔
I love that you not only shared your statistics but are also encouraging more transparency in the blogging community! It's great to see people are a little more inclined to share and I think it's important to break assumptions and help information share.
WOW, your statistics are soso inspiring, and I love this for you! It's amazing what you've been able to accomplish in a relatively short time. It's interesting that you find posting regularly appears to have an effect on your search traffic, though. So far, 2023 is on track to be my best year ever and I've posted 4 times this year, oops. SEE?! More proof that sharing information is so important, because what works for one person based on their experience won't work for another.
That is so interesting because I'm even more convinced of the fact that regular posting affects stats because I stopped posting as much this year and, in a few months, my SEO traffic is reducing! Definitely agree that sharing information is important because of this. There isn't one thing that works for everyone.
Thank you so much, Kal!
Ok I adore this post and you inspired me to peek at my stats again since I haven't checked them in a while. So far this year my top 5 countries are: USA, India, Qatar, UK and Singapore. I think USA is most likely to be top for nearly everyone likely because it's a large country filled with a lot of people who read and blog I guess? Another reason I think they will dominate is because the internet tends to be geared towards them, I don't know if you've noticed this but whenever I look for say a recipe or help on something. 9/10 the top results are from American's so clearly they must blog more? So then we would reasonably assume they'd stumble across other blogs more readily than other countries, where they have smaller populations and less people blog. That's just my two cents though hehe.
I think one thing I wished we shared more often were stats for those of us who aren't self hosted. Mainly because it's virtually impossible to SEO optimise and get ranked. My traffic is likely coming from other bloggers, I think I've possibly gotten views from other people who don't blog but that was only once I shared my guide post on Stray Kids. Your post has given me another nudge towards possibly doing my own stats transparency post though! Planning on doing it next year though as I am still wanting to gather data ^.^
I’m inclined to agree with you on the USA traffic, but it still baffles. we get USA-based results but USA gets our sites? weird.
oh yes, it’s true that not many who aren’t self-hosted share their stats. probably time for you to start the movement ?
first of all, i love this analysis!! it is so in-depth and well-thought out. i think it is so wonderful to see so much of your traffic coming from search engines, because that's something i believe gives blogs an edge over other social media platforms! second of all, you are a blogging powerhouse!!! i'm so glad that you've been seeing such good results for all your hard work <3
thank so much, May ?
and i agree, the search engine part definitely gives blogs an edge over social media, long-term traffic isn’t possible on them like blogs.