2024 was a year of not caring about stats. Although I looked at the numbers often and made notes, I didn't delve into them or the patterns that I noticed. In 2023, I realized that looking at numbers a lot did not help my motivation to blog and took steps away from it.
However, I'm still a stats nerd. Instead of looking at the numbers every day and thinking a bit too much about them, I'll look at them once a year and talk a bit too much about them 😂 As I've written posts on my blog stats for the past two years (2022, 2023), I wanted to write this to at least keep the streak. It'll be interesting to see my thoughts over time.
This post will be a bit different from the last two because WordPress is blocking me from viewing my stats because it tagged this as a commercial site. I'm not paying more than my hosting costs to view the stats. The numbers in this post are high-level numbers that I can see on the app.
Also, the stats are just a tiny bit lesser than what they would have been because my Jetpack integration didn't work for a few days.
2024 blog views
In 2024, this blog received 172k views. This is less than half of the 2023 number so it doesn't look great in the graph but otherwise, it's a damn good number! My blog posts received thousands of views in 2024 despite me just doing my own thing.
Most of the views were for pages that I published years ago during my SEO phase. They lost a lot of traction because it's been a while but I'm surprised that they still garnered a lot of attention.
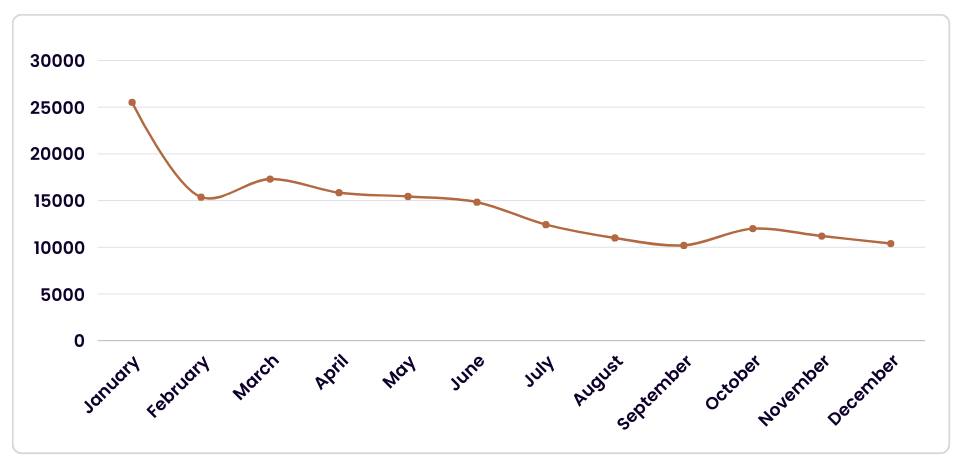
As you can see, the views kept decreasing over time because the old posts got less and less views. I'm also not working on new posts for search engine so the total view count is going down as well. While the graph doesn't look good, I don't want to work on bringing it back up.
Usually, I get more views November-January and that held true in the beginning of 2024. There's a dip in views when the holiday season ended. However, surprisingly, there wasn't a spike at the end of the year in the next holiday season. I was surprised by that.
Although the numbers are way lesser than what this blog used to get, I'm content with the numbers. It's nice to see that the tons of efforts I put in a few years back are still showing up. I like that some of my favourite posts are still being read by thousands of people years later.
I posted consistently in 2024 but they weren't optimised for SEO or targeted towards any audience. I simply wrote whatever I felt like. I wrote some of my favourite posts which will never get much traction because they're not "searchable" and that's okay.
sources of traffic
Most of the views and visitors were from search engines. There's no competition there. Even with dwindling numbers, search engine referrals far outrank any other.
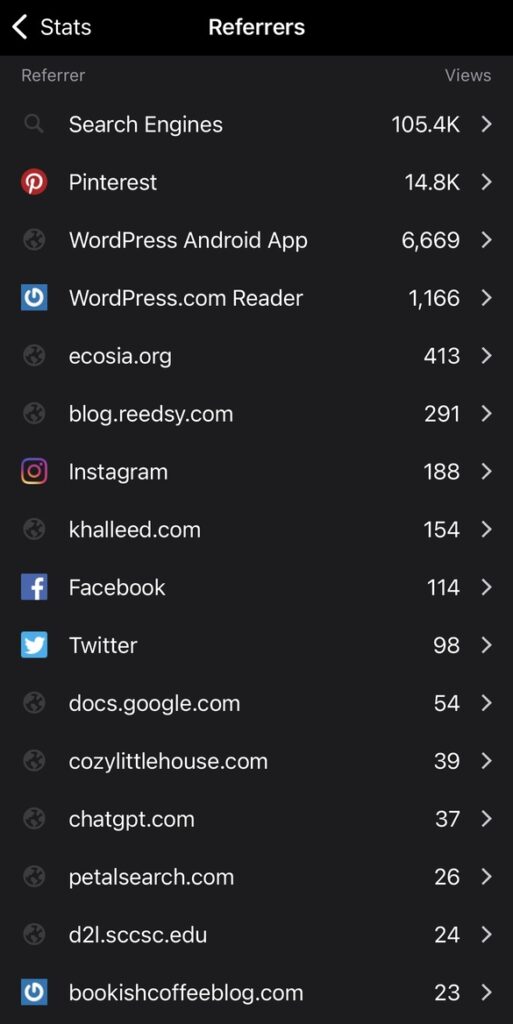
Pinterest is still #2 as well. Technically, it is also a search engine. Whenever I had free time and remembered the platform, I made pins but it wasn't often. Like from other search engines, the traffic from Pinterest is halved compared to 2023 but it's still significant.
#3 and #4 being WordPress is not a surprise either. Ecosia.org and Reedsy have also been top referrers for a while. I'm a bit surprised that Reedsy still sends a bunch of referrals.
188 referrals from Instagram is more than what I was expecting. I didn't use the platform regularly for the entire year. Sometimes, I installed the app only to share a link to a post on the stories and I'd uninstall it immediately after. I didn't cultivate a following there at all and am pleasantly surprised that people still came to my blog through the random stories.
#8 Khalleed.com is interesting because their post on BlueHost linked to my BlueHost review and that sent so many people to my blog.
#11 Google Docs is the most confusing one on the list. People add my link to public Google docs? I'm guessing that an educational institute created a doc and linked to my How to Annotate post but it's still funny to see it as a referrer.
There are a few other .edu and Google classroom referrals, I assume for the same annotation post. Considering that I wrote the post "for fun" and clearly said that I don't have experience annotating in academia, it's received surprising popularity in academia.
One way I understand the rise of daily AI usage is by seeing how many people come to this blog through AI engines. As you can see, ChatGPT and Perplexity.ai sent about 50 referrals. Way more people would have benefited from my content because they'd have read a summary on AI engines because only a subset of people would click through to the source.
Some other random referrals that deserve shoutouts: Google lens (how?), Snapchat (????), Google Translate (Can you feel my confusion?) and Microsoft Teams (are people sharing my blog posts in their work chats?!).
best performing posts
I published 52 posts in 2024 and the most popular post was my review of A Time Called You Kdrama at #12. The next one was The Last Queen book review at #38.
Both of the above were published in January 2024. The Kdrama review got way more traction than I expected, even though I've seen my Kdrama reviews usually do well. It received 3143 views throughout 2024.
The top 10 posts were all old posts that have been doing well on search engines for years.
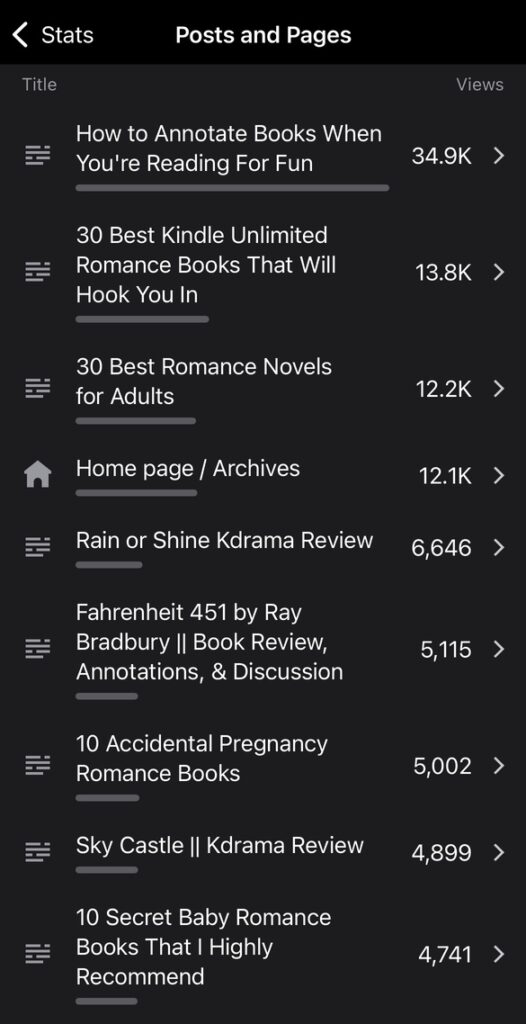
To no one's surprise, How to Annotate Books When You're Reading For Fun is at the top. The second post didn't get even half of the views that this one did. I wrote the post in 2021 because I was passionate about annotating and it took a life of its own.
The annotation post got 111k views in 2022 (my peak stats year) so 2024's 40k views doesn't sound much. But 40k views is a LOT and contributed to almost 1/4th of the blog's overall stats.
My book review of Fahrenheit 451 is another post that took a life of its own. I absolutely loved reading it and shared my random annotations. I didn't expect it to garner so much attention. It was published in 2022 but had its best year in 2024 with 5k views.
The others that made to the top of the list are not a surprise. They've been topping the charts with the annotation post for the past few years now. I'm surprised that they're still doing well in search engines after years despite the algorithm changes and lack of updates.
A post that didn't receive much views compared to the above but surprisingly got a lot of views was How I Made My First YouTube Vlog. It got almost 1k views in 2024 with most of them coming from Pinterest towards the end of the year where I posted ONE pin on it. It's been a year since I made a vlog but this post is still doing well because of that Pin. I've even received DMs on Instagram about it!
audience
I love looking at the countries from where this blog gets views. It's so cool that I write at home and it reaches people all across the world.
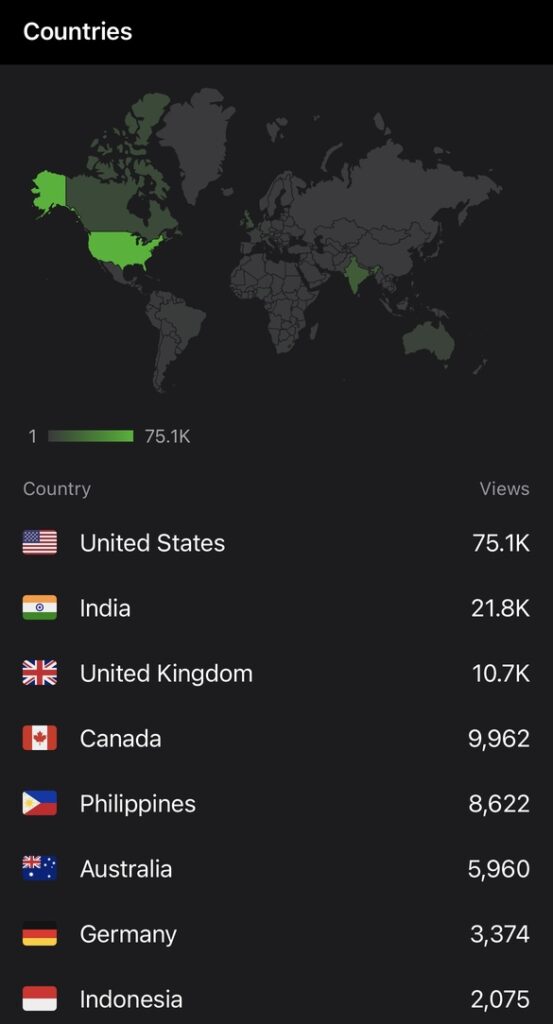
All of the countries on the above list have retained the same place since 2023. The only surprise is Indonesia which was not in the top list in the previous two years. It replaced Malaysia.
I shared my thoughts on the countries last year but I have newer thoughts now. My annotation post is the most popular and could honestly keep this blog "alive" by its own. That post skews my metrics a lot and I didn't think about it also skewing audience metrics.
It is possible that this blog receives very high readership from the US because of the annotation post. Most of the educational institutes I notice are in US. A lot of students from there must be coming to my blog.
I'm happy to see India being second, though. Sometimes, I feel disconnected from my community because I pursue a hobby that's not popular or mainstream. But it looks like a lot of people search things which leads them here.
engagement
Usually, engagement numbers are proportional to number of posts published. As I posted more in 2024 compared to 2023, I'm expecting a slight uptick in numbers. But then, I also think that active readership has reduced (and many of my friends quit blogging...). Let's find out together.
At the beginning of 2024, the blog had 2657 subscribers. At the end of 2024, there were 2663 followers. That is 6 new subscribers! The exclamation mark is valid because even 6 more blog subscribers is more nowadays. The number went up and down throughout the year.
In 2022, this blog had 730 comments with 39 new posts. In 2023, it reduced to 554 comments due to only 30 posts. In 2024, there were 554 comments for 52 posts. The number is same as in 2023.
There can be a few reasons for this. In 2024, although I posted more, many of them were book reviews. Book reviews don't get a lot of engagement due to different reasons. I also didn't write many discussion posts which would get more comments. The 554 number includes my replies and links/pingbacks but it's still a lot.
The top posts with most comments were Words of June and Words of October. It's unsurprising that wrap-ups got the most engagement because they have the most scope for discussion. I write random thoughts and life updates in them which are easier to talk about compared to book reviews.
Most of the comments were from my friends. Over time, the blogging community is becoming a tight knit circle. We're reading each other's posts and commenting. When people quit blogging, it's noticeable. In 2024 alone, I noticed so many blogs that I loved which haven't been updated in a long time. Among my initial blogging friends, I'm the only one still posting.
Although the number of comments might not have changed, the quality of them definitely have. As I mentioned, we're becoming a tight circle. We've been commenting on each others' posts for so long that we're friends now and write essays in the comments. I got many long comments in 2024 which I absolutely loved.

endnotes
This post is pretty short compared to my usual length and that's because I don't have much to say about the stats this year. As I mentioned at the beginning of the post, I took steps away from looking at stats. Jetpack blocking me from looking at detailed stats was good in that way—even if I wanted to, I couldn't see the numbers to think about them a lot.
I'm grateful for all the views and engagement. The world has properly opened up now after the pandemic and most of us don't have 5 minutes to read a long post. Is it really surprising that TikTok and Reels are booming in popularity? Even I find it easier to see highlight clips of my favourite TV shows than watch the entire episode. So the fact that my long posts get any views and comments is amazing. Each long comment is extra special.
I ended the 2023 blog stats post saying that I hope to be content with my work in 2024 no matter what the numbers are. I'm happy to say that I am. The graphs and +/- percentages stopped being important, sharing what I was passionate about was important.
In 2025, I hope to continue the same way. Whether my posts are popular or not, whether the numbers go up or down, I want to write about what I love and talk about it with friends.
chat with me!
Are you a numbers person? Have you noticed any trends with the stats on your blog or social media? Which content of yours gets the most engagement? Tell me in the comments!
Sumedha spends her days reading books, bingeing Kdramas, drawing illustrations, and blogging while listening to Lo-Fi music. Read more ➔
My nerdy heart soared when I saw this post; it's just beyond intriguing to see what kinds of content people like, where it does well, and how other bloggers are affected by their stats! 🤩 This was fascinating and I honestly feel super guilty for taking so long to respond... Still, I'm hoping me giving you some of my own numbers in return will make up for that at least a little bit!
Anyway, it's interesting that your views are decreasing so much - maybe that's because you have such a big following to begin with that new WordPress views don't make that big of a difference anymore compared to the search engine ones? 🤔 My own views actually stayed pretty stead in 2024, although I did also have the typical post-January dip. In 2025, though? My stats are all over the place because I actually turned off the search engine indexing rights for the first three months - unlike you, the thought of people from my own country reading my blog does not make me the most comfortable (What if I KNOW them? 😱😂), so I figured I needed to take action to make my blog less accessible. And the results where FASCINATING! Like, sure, my views dropped to almost nothing - like you, I get most traffic from search engines (43,721 compared to 980 from the WP reader in 2024), but what also totally went down were the US views. So unless Trump has started banning people from accessing certain websites (which I wouldn't put past him 🙄), I guess that means you could be right about search engines really directing US viewers to bookish content for educational reasons? My WordPress views were actually WAY more balanced according to country - things were really mixed there!
Also, I'm cackling over some of your traffic sources! 🤣 Seriously, if you ever find out which Google Doc you made it into, do tell us! Or Google Translate, for that matter!
It's also fun seeing which posts of yours are the most popular. In my case, those are mostly book reviews - in 2024, the leading candidate was the one for A Court of Silver Flames with 11k views, probably because the book is super popular and my review is negative 😂 My negative reviews always do way better than the positive ones... Though maybe the accidentally pregnancy and baby aspects of it are what's drawing people in - clearly, they seem to appreciate that 🤔
Getting comments from friends is my favorite part of this community! 🥰 Apparently, I got 892 last year (though half of those are probably my own responses 🤔), and that's just insane. That's probably more words than my blog posts themselves! I'm just so glad we have this wonderful, tight-knight community and happy to see that part of your engagement is still going strong, too. 🥰 If you don't need your blog to make you money, I feel like you don't really need more than that anyway! I, for one, am thrilled to be here, and thanks again for sharing all these numbers with us! 💙
Take as long as you want to respond, I'll be just as happy to see your comment! And what a mammoth of a comment, I opened my laptop to respond well 😂
I don't think the views decreasing is due to the WordPress following in the first place. I'm pretty sure most of my following is dormant at this point because most of the followers are years old and I don't see much activity. The thing is, my posts had a huge increase in 2021/2022 because I wrote a TON that were "searchable" and blew up in search engines. Now that their lifetime is ending and newer posts by others are up on the topics, the views are dwindling. And yes, the WP views were a fraction of the search engine traffic since years so I've stopped even comparing them.
You turning off your search engine indexing and seeing the results is a lowkey experiment! The reason for it is fairly funny though 😂 I don't worry about people I know reading it because at this point I do share it with people I know and contrary to my expectations, not many people I know bother to read my blog even if I talk about it all the time (on one hand I'm disappointed but on the other I'm relieved, I guess?). Also India is soooo large now that I don't have to worry about it.
Your US views going down is interesting because it matches with a theory that I have—way more people search topics that we write about in the US than other countries. Or it's because of US VPN. It's funny, because you'd think India with a much larger population would search more but it also makes sense that US people search about art more than my country which runs on software engineering and medical. Absolutely no one would use my annotation post in schools in India unless they're part of international schools, but it's more common in the US.
Oh yeah I agree that negative reviews draw more people. My Kdrama review of Vincenzo BLEW UP because it was negative. The funny part is that I got more comments with disagreements than agreements. Like, people would comment saying I don't know what I'm talking about, did I even watch the drama, and that I don't need to be so serious. After a bunch of those, I added a disclaimer in the beginning that it's a negative review and don't read further if you loved the show but people still did and commented saying that I'm wrong? Negativity seems to bring out a lot of engagement—whether for or against the views. Makes me a little sad about the state of the world, I won't lie.
I agree! Comments from friends is the best. Yes, the total count that WP shows includes our responses and any pingbacks from links. So it's probably half or less the actual number but the ratio/comparison still counts.
Thanks for sharing patterns from your stats, Naemi! It was interesting 😌
Hi Sumedha! I'm so happy that you found joy in just writing whatever you liked, and your numbers show that people do love what you write. I'll catch up on your blog soon, and in the meantime, here's a big hug! (with consent, of course). You deserve one for staying consistent and passionate about keeping this space alive. Hopefully, I can blog more often soon.
Hi Nae! It’s so nice to hear from you again!
Thank you for the hug, here’s one back! I hope you’ve been doing well 😊
I didn't really look at numbers before, but I've started to more because it motivates me to keep writing when I can see that my posts are reaching people. It's not really influencing what I'm actually writing about though, and there's a different kind of motivation when I receive long comments 😊 My most viewed post is a review I wrote about a Chinese dating show, which I wouldn't have expected - it's from quite a while ago but even now the views continue to go up. Maybe there's just the right balance of not enough people writing about it and enough people being interested to read about it.
It’s interesting how posts that we least expect traffic for do well! Probably because most others write for the top demand queries while we’re wilding and get traffic for random queries 😂
Yeah maybe haha
Amazing post! I always love to check yearly stats and compare them with previous ones. My 2024 stats was lower than previous year as well. I’m definitely checking that KU romance post now.
Thank you! Maybe the reducing stats is a trend across websites due to common factors 🤔